Vehicle comparison by consumption
Comparison of vehicles by consumption by group of vehicles or vehicle fleet. Displayed in this report will be information on fuel consumption on the board computer (FMS data) and information received from the fuel level probe. Our suggestion is to use this report exclusively for analyzing data received from the FMS, data received from the probe are mainly intended for discovering fueling/emptying of the fuel tank. For more info, check "Experience" button below the video. The accuracy of the data depends exclusively on the accuracy of the board computer, the CVS does not “create” that data, but rather it transfers it from the board computer to the application.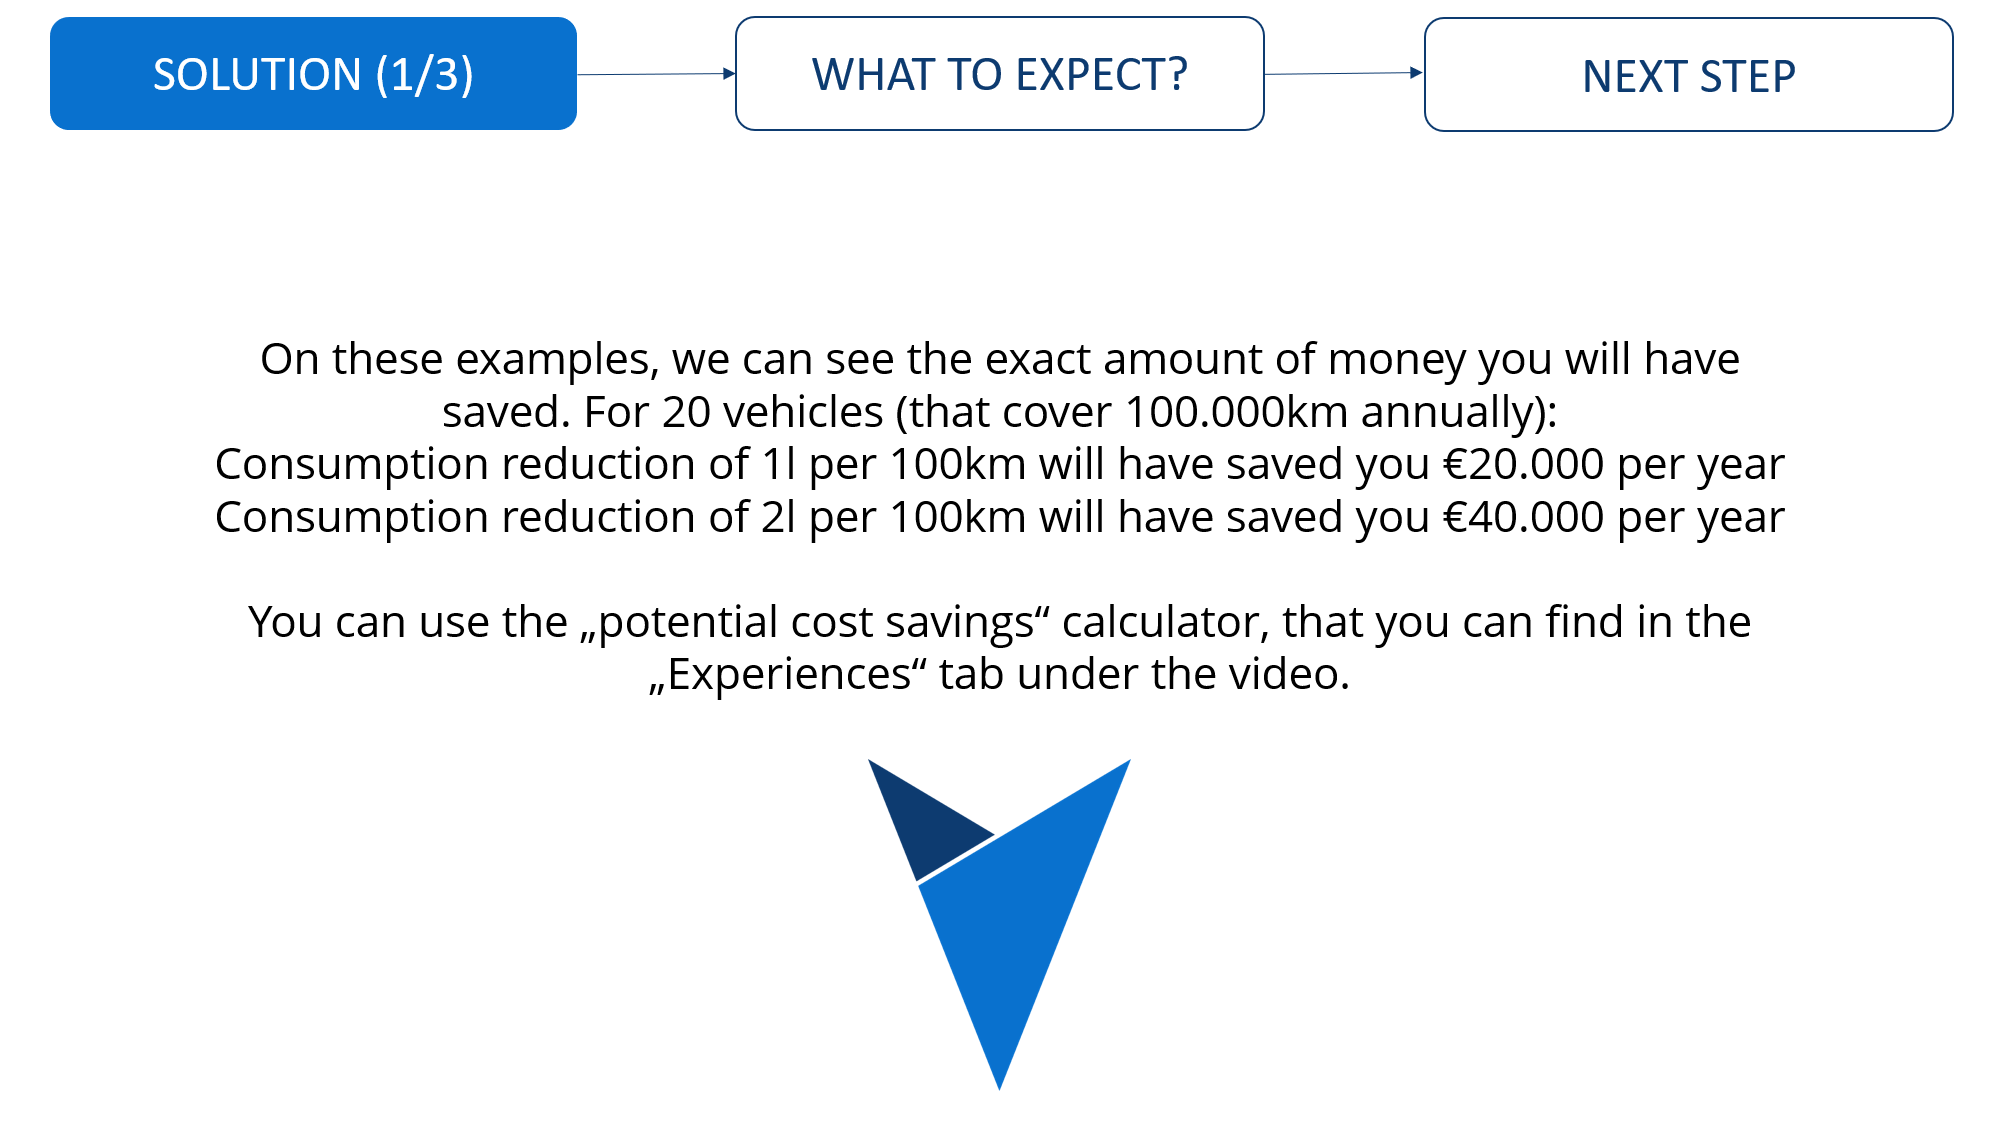
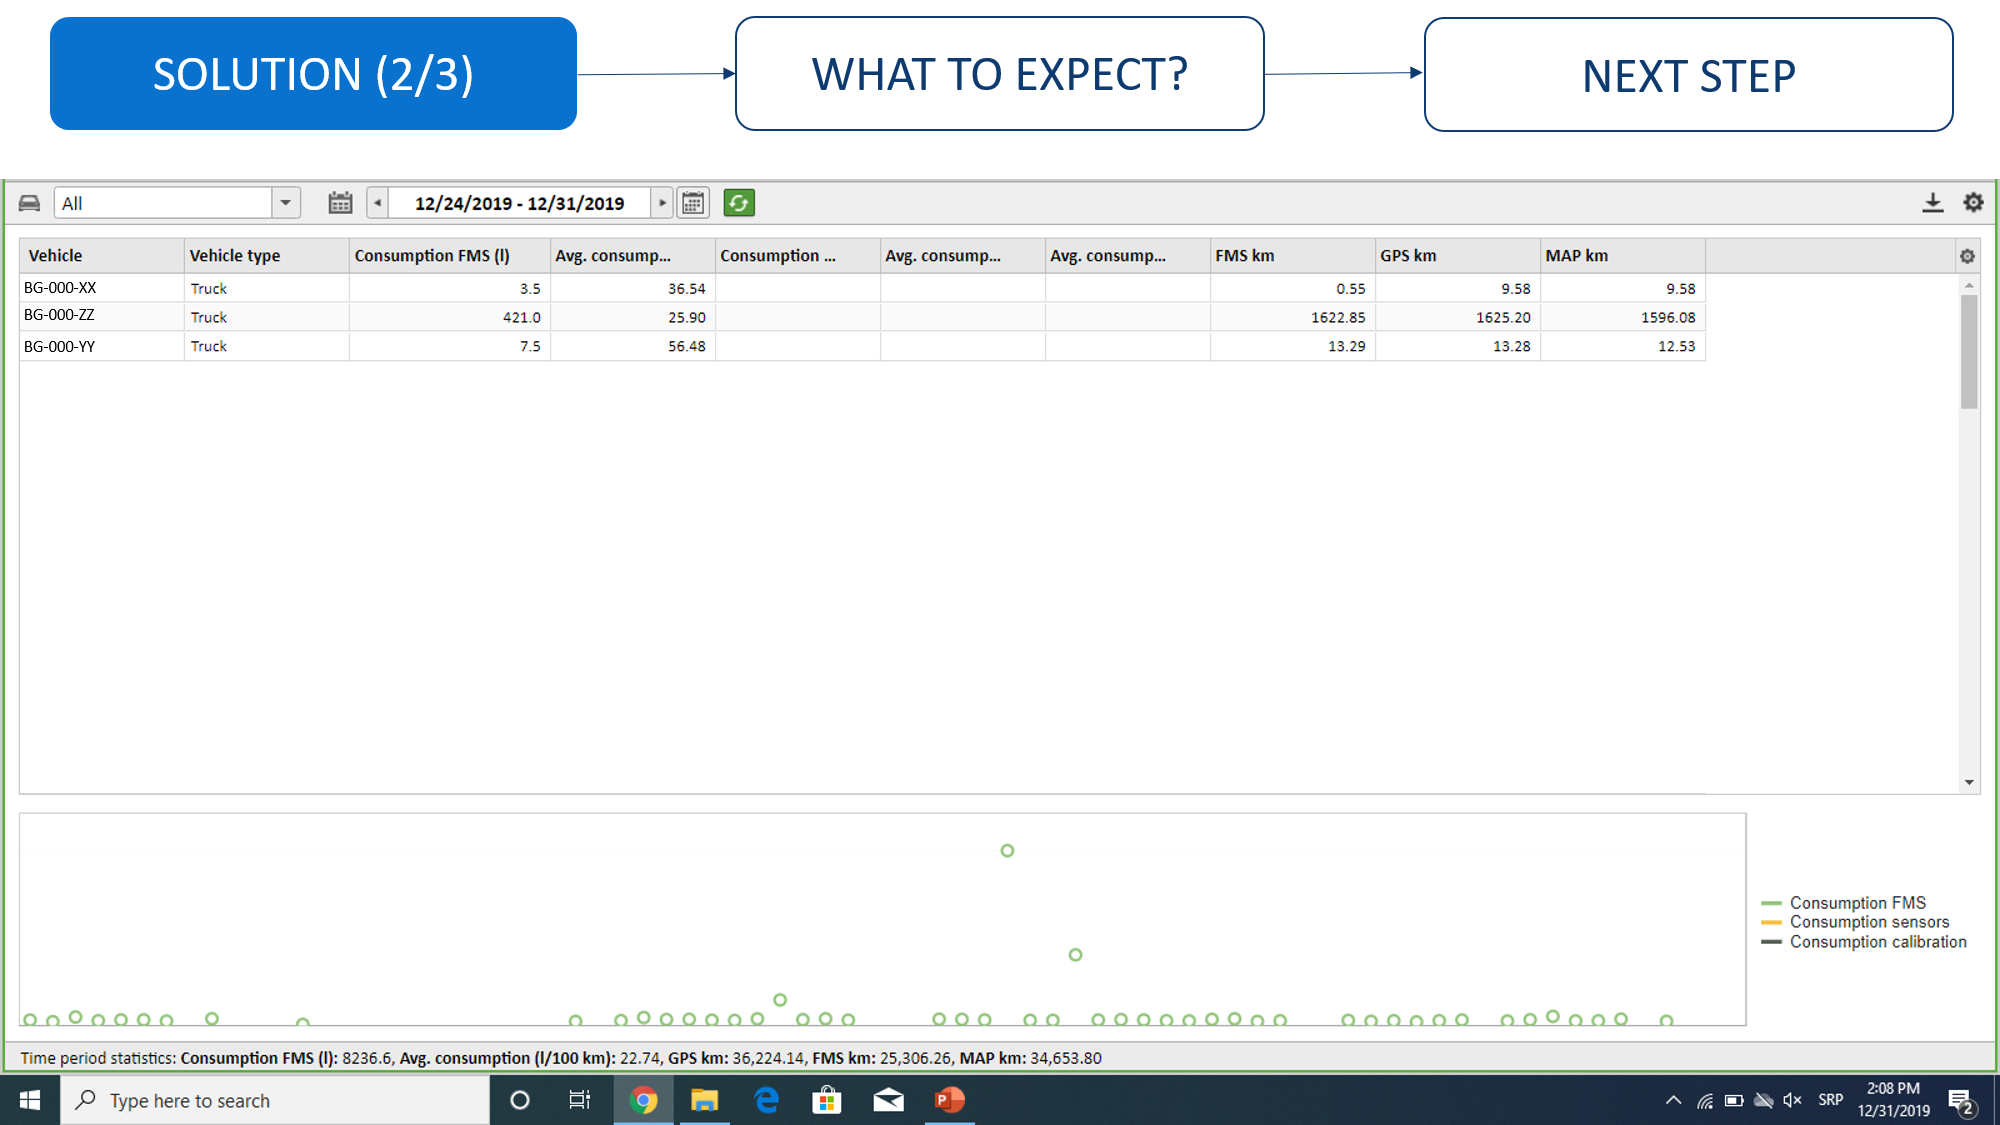
Consumption overview by vehicle
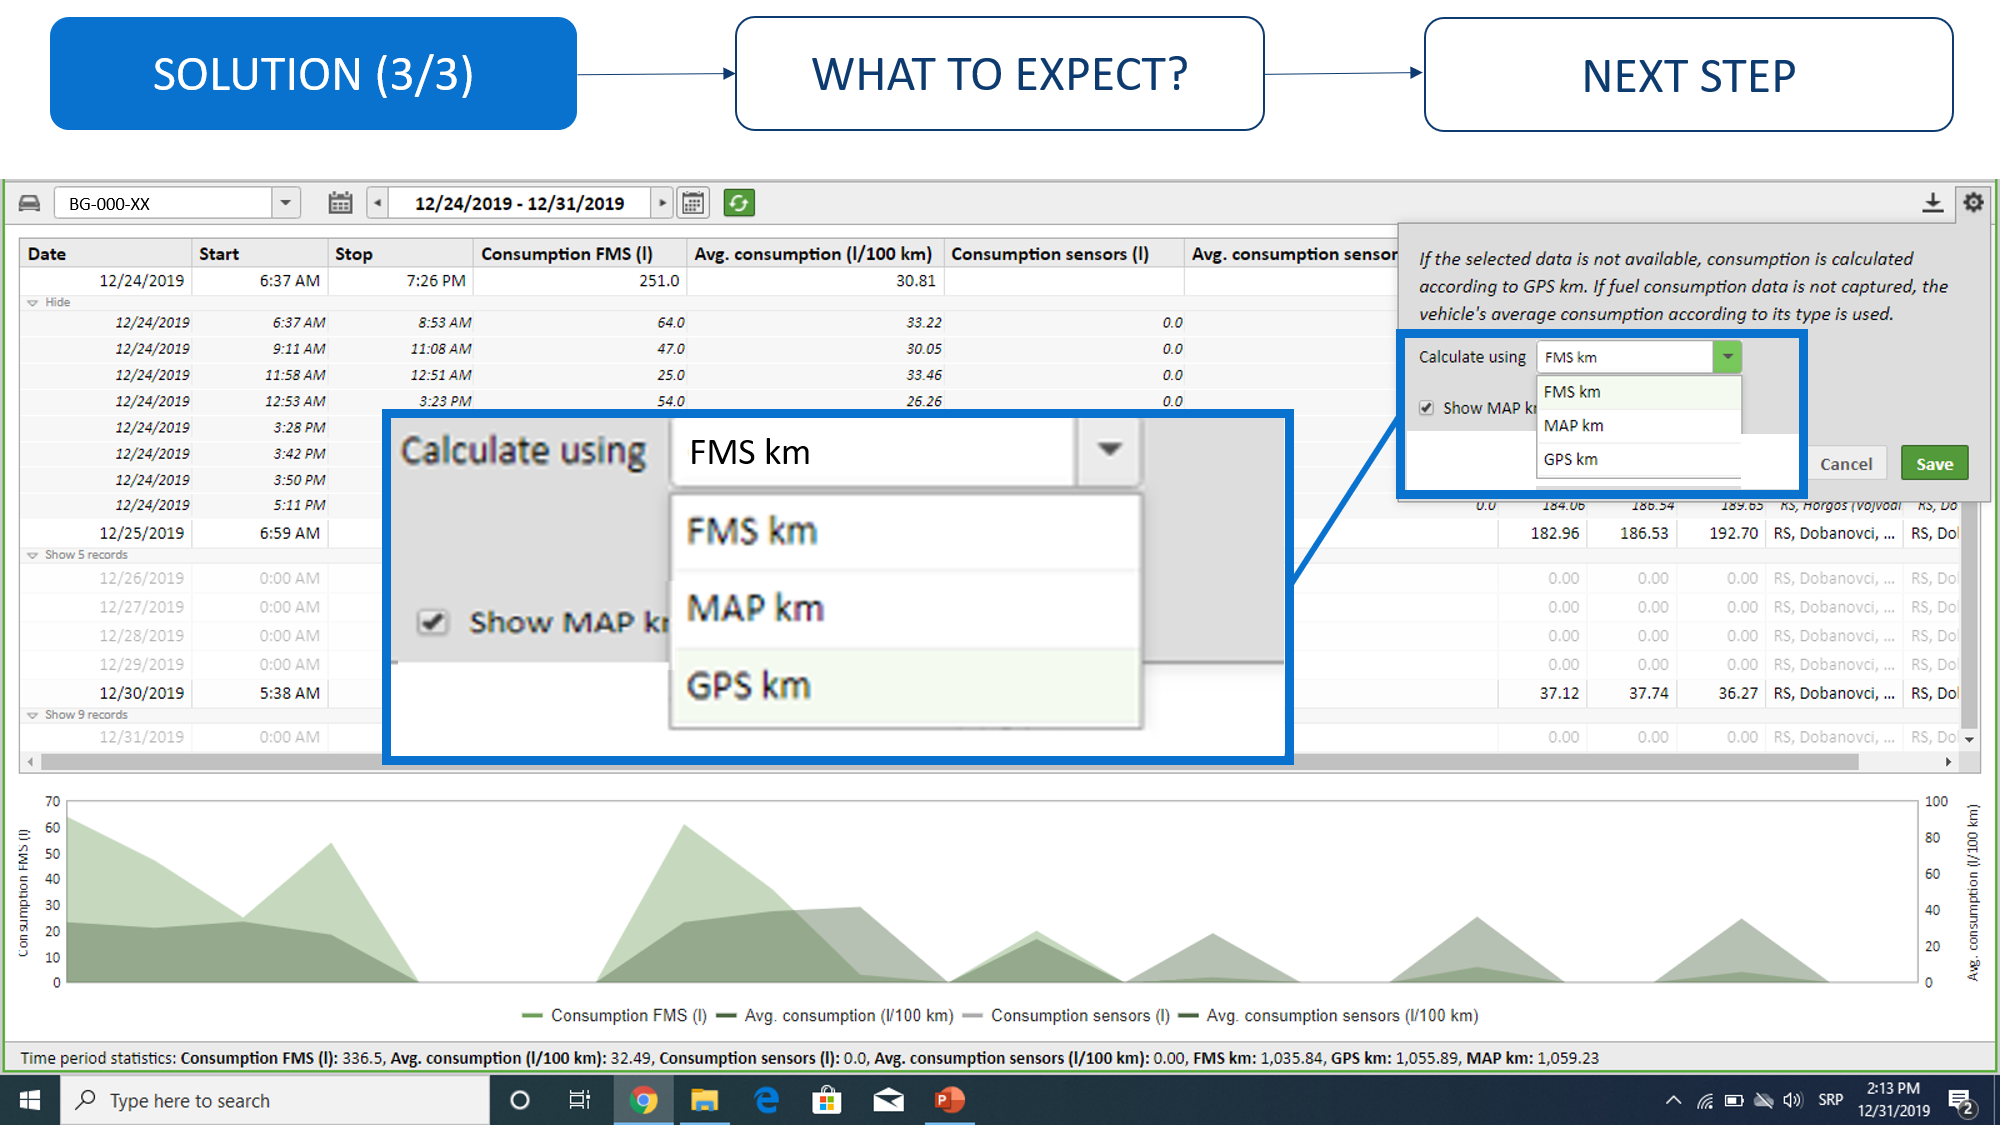
How an analysis of fuel consumption by vehicle can be done. Displayed in this report will be information on fuel consumption on the board computer (FMS data) and information received from the fuel level probe. Our suggestion is to use this report exclusively for analyzing data received from the FMS, data received from the probe are mainly intended for discovering fueling/emptying of the fuel tank. For more info, check "Experience" button below the video. The accuracy of the data depends exclusively on the accuracy of the board computer, the CVS does not “create” that data, but rather it transfers it from the board computer to the application.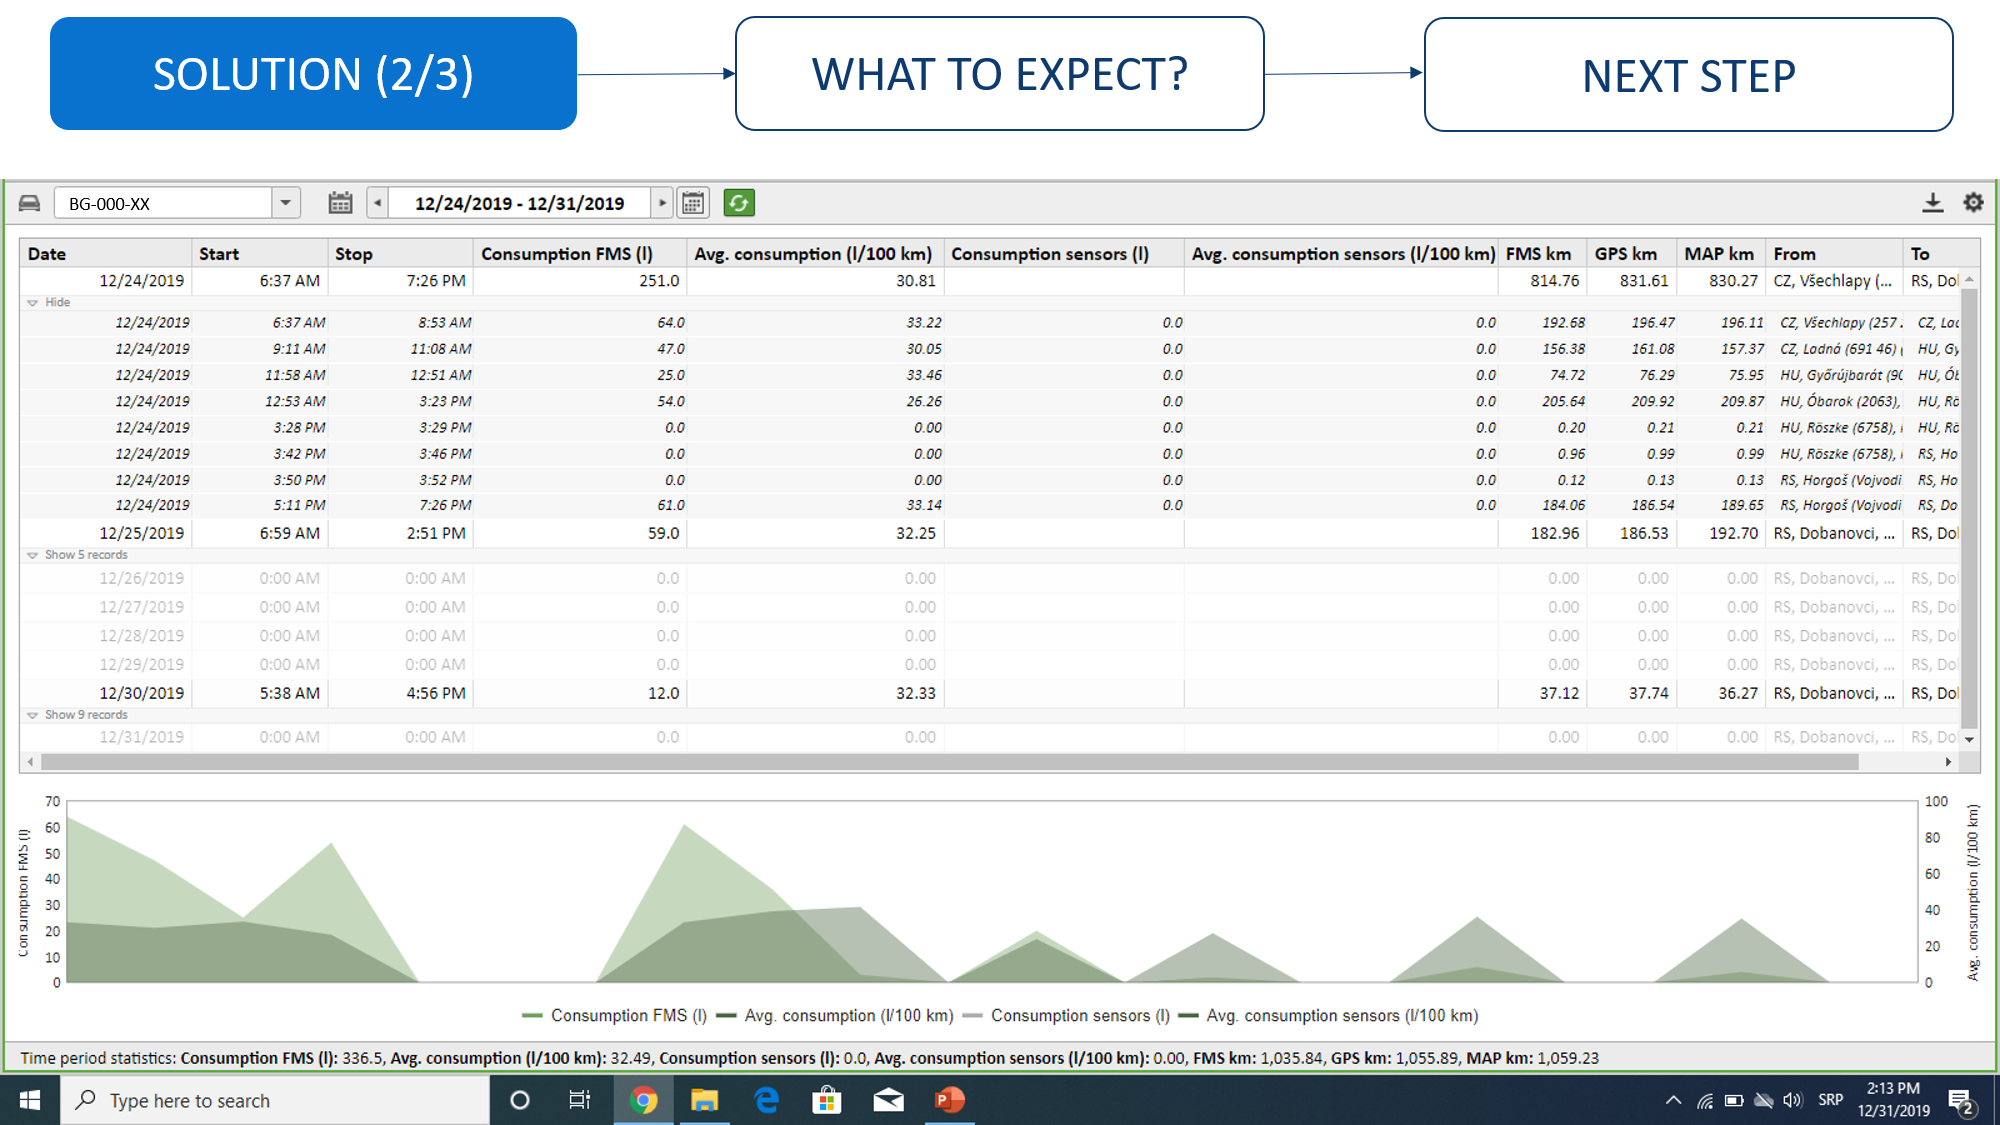
Experiences
Potential cost savings
If we assume that a transport company has 20 vehicles and that those vehicles cover around 100.000km annually, the potential cost savings are:
- If the average consumption is reduced by 1l per 100km, the savings would amount to 20.000 EUR per year.
- If the average consumption is reduced by 2l per 100km, the savings would amount to 40.000 EUR per year.
Click the button below to download the cost savings calculator.
Calculating the expected average consumption relative to the travel route and weight of the vehicle (including trailer and load)
Poland: 28l/100km + 0,6lit/t
Turkey: Istanbul > border: 26l/100km + 0,4 lit/t
Turkey: Izmir > Poland: 24l/100km + 0,5 lit/t
Turkey: Istanbul > Poland: 24l/100km + 0,4 lit/t
Turkey: Istanbul > Denmark: 23l/100km + 0,4 lit/t
Turkey: Izmir > Denmark: 23l/100km + 0,5 lit/t
Germany: 21l/100km + 0,4 lit/t
Hungary: 22l/100km +0,4 lit/t
Example: Izmir > Poland with 20t of cargo
Base consumption: 24l/100km +(20t*0,5 lit/t) = 24+10=34 l/100km
Note: this information should be used as general guidelines. The expected average consumption is also affected by the brand/vehicle model, model year, state of the vehicle, pressure in the pneumatics - 1 bar = 1 lit/100km
Fuel level: The difference between the FMS data and real average fuel consumption.
This data is extracted from the practical experience of our business partners (transport companies).
Vehicle Model | The inaccuracy of the FMS in calculating the average fuel consumption. |
Mercedes MP2 | FMS data is 1lit/100km lower comparing to real avarage fuel consumption |
Mercedes MP3, 2010. | FMS data are 2lit/100km higher comparing to real average fuel consumption |
Mercedes MP3, 2008. | FMS data is 1lit/100km lower comparing to real average fuel consumption |
Mercedes MP4 | FMS data is 1,3 – 1,8lit/100km lower comparing to real average fuel consumption |
| Mercedes Axor Euro 5 | FMS data is very similar to real fuel consumption |
Man Euro 6 | FMS data is 1,06lit/100km lower comparing to real average fuel consumption |
Man Euro 5 doo 600.000km | FMS data is 1,09l in summer, 1,11l/100km in winter lower comparing to real average fuel consumption |
Scania 2008 | FMS data is 1,5 lit/100km to 2 lit/100km higher comparing to real avarage fuel consumption |
Volvo Euro 5 | FMS data is 1,09L in summer, 1,11/100km in winter lower comparing to real average fuel consumption |
Questions and answers
FMS doesn't count fuel which has been returned to the fuel tank by return hose
The expected consumption of the webasto device is around 0,2 lit/h
- The expected consumption while the vehicle is idling, is around 2,5 - 3,5 lit/h in summer, and 5 - 7 lit/h in winter.
Why is the amount of liters consumed per FMS different in the “Statistics interval” compared to when each row in the report is manually added up?
The information in the rows are received from the FMS computer and are displayed per travel route.
- Example: when all the rows are added up we get an amount of 180 lit.
- The data in the statistics interval amounts to 210 lit for the same time period. That data is not obtained by adding up the number of consumed liters from the rows positioned above. That data is obtained from the numerator of consumed liters since the vehicle was manufactured (FMS). Using this principle:
- the start time chosen in the report: 14:00 01.01.2018. - that was when, according to the fms liter numerator, the vehicle (since it was manufactured) had spent for instance 30.000 liters and had 100.000 km on the odometer
- the ending time chosen in the report: 14:00 02.01.2018. with 30.210 liters and had 100.700 km
- Conclusion: fuel consumed during that period - per statistics interval: 30.210 - 30.000 = 210 liters. Included in this data may be the fuel consumed for Vebasto, idling and anything else that the computer may see as consumed fuel but will not show up where consumed fuel is displayed per route. This data is transferred by the CVS from the FMS to the application and for more information the vehicle manufacturer should be contacted.